THE PHILLIPS CURVE
So there's been quite a few requests asking me to cover The Phillips Curve so I thought it made sense to dedicate its own page to it. You would think that it's rather complicated which, is what I intially thought too. But its actually quite simple once understand what it is trying to show you. The most important step is to actually understand what it is, and what it is trying you tell you.
It's pretty useful to know how to draw and what it represents because you can use it in pretty much any unemployment essay. It only takes a few seconds to draw and there's no thinking required.
WHAT IS IT?
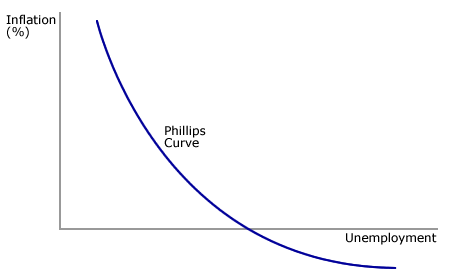
The Phillips Curve basically illustrates the trade-off between unemployment and inflation rate. In otherwords, the relationship between the two.
Below is the graph. I'll try to explain it as simply as I can. Let me know know on the Comment Page if it helps. If not ill try to explain it again if I have to!

You can see from the curve that is moves down the Y-Axis it is also moving across the X-Axis at the same time. The is the definition of a trade-off. It's a bit like oppurtinity cost. Inflation cannot change without Unemployment also changing.
You can look at it either way you perfer, but I personally look at it starting from the top.
So as you move down the curve, inflation is falling but Unemployment is rising at the same time. This means that there are less people in employment if inflation is falling.
Respectively, if employment rises and unemployment falls, it will be that we are moving back up the Phillips Curve and a rise in inflation.
WHY DOES THIS HAPPEN?
Now we know our theory of economic growth, inflation and unemployment. Inflation rises during a posative output gap due to the inflationarry pressures created from the rise in AD. Why does AD rise? Because people have jobs and therefore have more purchasing power to buy more goods and sevices.
In the same way, if unemployment is increasing, it means that less people have jobs. And therefore they have less money to spend so consumption falls. This automatically means a fall in AD which will result in a fall in inflation.
The Phillips Curve basically indicates:
A rise in inflation = A fall in unemployment and increase in employment.
A fall in inflation = A rise in unemployment and fall in employment.
TIP: Dont let the unemployment axis confuse you. The closer you are to the Y - Axis, the HIGHER the employment because the level of UNEMPLOYMENT falls.
Also: If your're wondering why the axis doesnt touch the Y-AXIS, yet it does touch the X-AXIS... It's because if you think about it, in theory it's IMPOSSIBLE for there to be NO UNEMPLOYMENT. As great as it would be, there will always be unemployed people, because regardless of being able to, some people will still refuse to work.